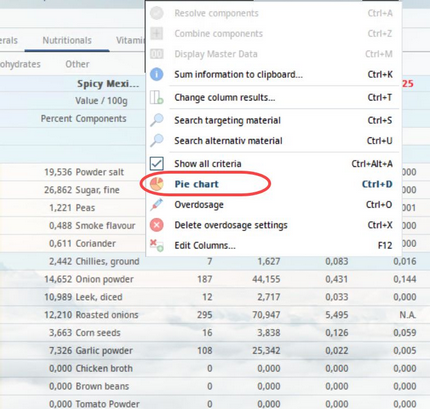
In each of the Calculation tabs, you can view a graphical representation of selected criterion values per components. Right-click on a relevant criterion value and choose Pie chart from the displayed context menu. In order to have this option enabled, all values of that certain criterion have to be present and numerical.
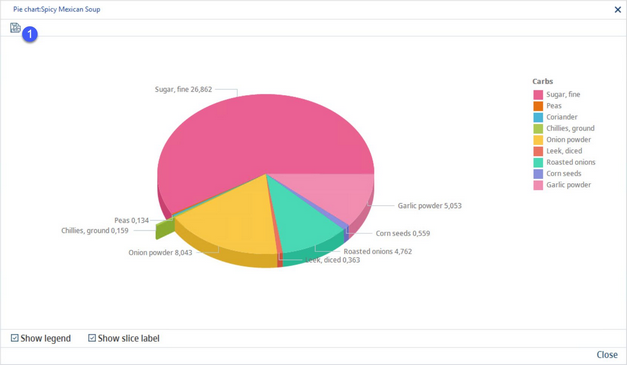
The pie chart dialog will display.
The pie chart can be saved as an image by clicking on the button labelled 1. Use the Show chart legend or Show slice label options to show/hide further chart options. The image is saved to the SpecPDM installation folder.

