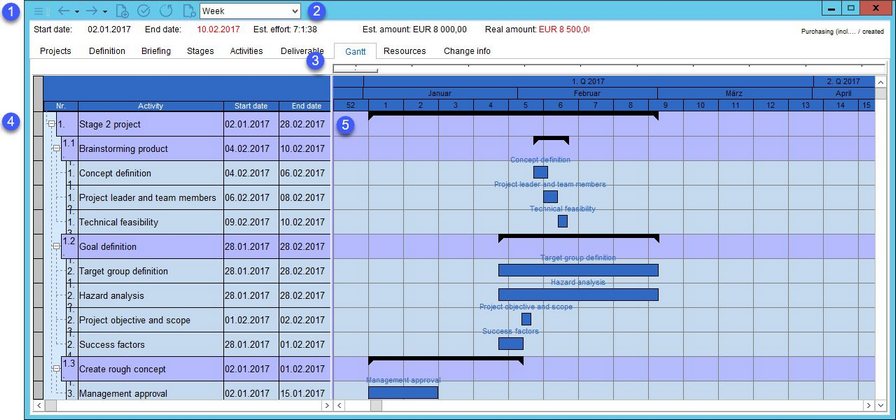
In this tab, project stages with their activities are represented as a Gantt chart (a bar chart illustrating a project schedule). The duration of the activities is graphically visible in this diagram.
1.Quick Access Toolbar: For more information, see Project/Functions & Processes/Basic Project Functions.
2.Time frame: Change the diagram time frame. The default setting is a Week view.
3.Zoom: Use the slider to zoom the diagram in/out.
4.Graphical view: Project stages with their activities.
5.Chart: Graphical representation of the stages and activities over set time frame.
